ECA INSIGHT >>
On 1 November 2020 Greece reached a significant milestone by launching the European Target Model for the operation of its wholesale electricity market. Initial implementation was reported as being successful. However, as early as December 2020 the Regulatory Authority for Energy (RAE) announced it would investigate the prospect of setting a cap and floor for the balancing market after observing especially volatile and high prices.
Price spikes are not necessarily a reason for concern. While regulatory interventions have been required in the wholesale electricity markets of other EU countries and the UK, these need to be carefully evaluated because they have the potential to hinder competitive and smooth market operation, especially in a newly established market.
Greece’s Target Model
The European Target Model aims to set the foundations for a single market in Europe, enabling transparent trading across borders. Greece implemented the model on 1 November 2020 and was the last EU member state to do so following delays. Greece’s target model comprises the:
● Day Ahead Market (DAM): A crossover auction where a clearing price is established at the point where the cumulative buy curves and sell curves intersect, setting prices and delivery for the following day.
● Intraday Market (IDM): A market for adjusting balance positions after DAM closure.
● Balancing Market (BM): Balancing the system closer to real time.
Another significant milestone was achieved on 15 December 2020, when the DAM was coupled with that of Italy. Coupling with the Bulgarian DAM is expected to follow in Q1 of 2021.
Comparing 2020 DAM price averages since its launch in November to the equivalent months in 2019 and 2018 does not indicate any obvious complications (see Figure 1 and Table 1 below). The average monthly price in November and December 2020 is slightly lower compared to the equivalent period in 2019, for example. Increased price variability is observed in 2020 compared to both 2019 and 2018, with prices over €70/MWh observed at times, potentially indicating a tight market.
Figure 1 DAM prices, Nov-Dec 2018-20 (daily average)
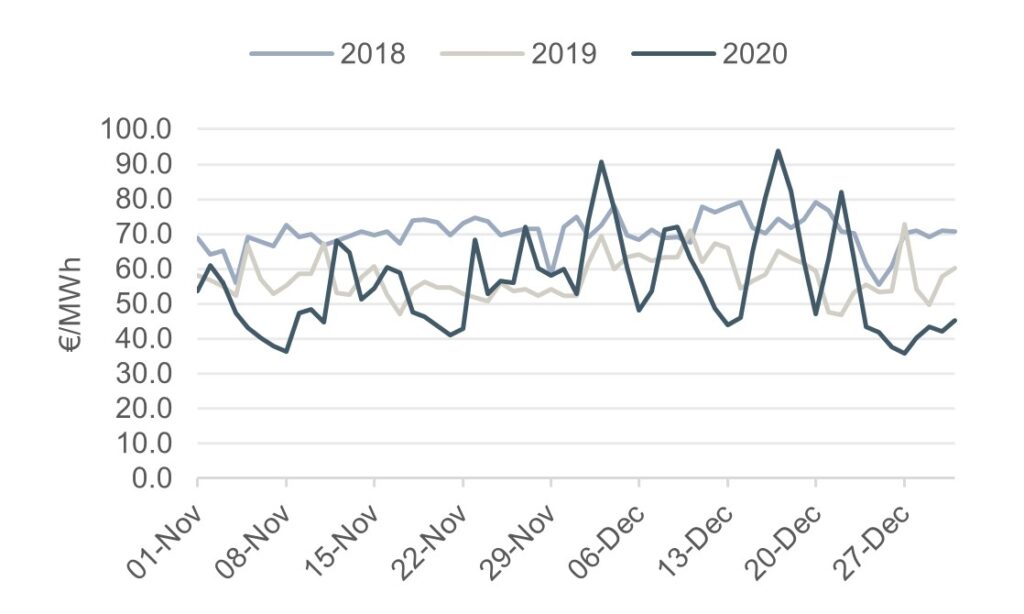
Source: ECA analysis – ENTSOe data
Table 1: Monthly average DAM prices, 2018-20
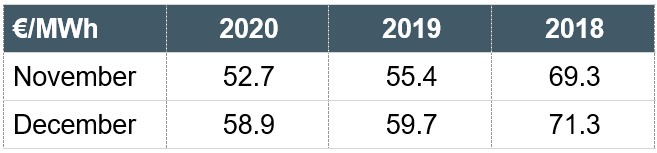
Source: ECA analysis – ENTSOe data
The prices between years are not directly comparable as they depend on many factors. Although some differences could be attributed to a maturing market, in which price volatility is not unusual, the latter could also depend on fundamental differences in demand, the generation mix, generation and network availability, commodity prices and other elements.
Balancing market
If the Independent Power Transmission Operator (IPTO) observes that supply and demand schedules matched through the DAM and the IDM will not match in a certain settlement period, or that operational standards such as the system frequency range is not maintained, it must take actions to adjust generation or demand accordingly to balance the system.
The IPTO does so by accepting offers submitted by market participants in the BM to increase or decrease generation or consumption. Participants are required to submit offers for their total available capacity in the BM, per 15-minute interval (representing both the BM interval and the Imbalance Settlement Period).
Regulatory intervention
Following a review of BM prices since the target model’s launch, RAE announced on 17 December 2020 that it would be considering and consulting on the introduction of caps and floors to BM prices for a transitional period of three months. This was triggered by the high prices observed since market commencement, especially during the week 30 Nov – 6 Dec 2020. The BM energy cap and floor prices suggested initially by RAE were a cap of €50/MWh, or €300/MWh for dispatchable generating units with alternative fuel[1], and a floor of €0/MWh.
The following figure illustrates the imbalance prices occurring during the week 30 Nov – 6 Dec in a duration curve sorting prices from highest to lowest in 15-minute intervals. This shows the manual Frequency Restoration Reserves (FFR) up and down prices in the BM that had to be activated as part of IPTO balancing actions together with RAE’s suggested caps and floor.
Figure 2 Imbalance price, 30 Nov – 6 Dec 2020
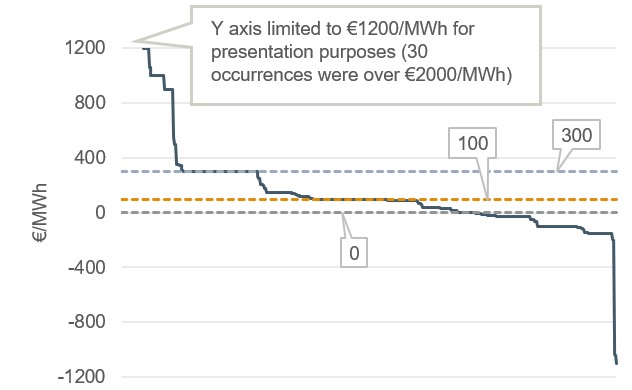
Source: ECA analysis (duration curve) – IPTO data
Based on the initially suggested cap and floor prices, this indicates between 53% and 70% of imbalance prices would have been affected (depending on how many of the >100 & ≤300 prices are from distributed production from alternative fuel).
Figure 3 illustrates the same imbalance prices as Figure 2 against the activated balancing energy in the week 30 Nov – 6 Dec. Periods where the activated balancing energy is positive indicate the market was “short” (demand outstripped supply) and when negative that it was “long” (supply outstripped demand). During this time, the BM was more short (61%) than long (39%). All of the exceptionally high prices (>€2,500/MWh) occur during short periods with a cluster of them appearing in the €3,000/MWh region followed by another cluster of high prices at about €1,000/MWh. During long periods, three instances appeared where the price was between -1,100 and -1,000 €/MWh.
Figure 3 Imbalance price against activated balancing energy, 30 Nov – 6 Dec 2020
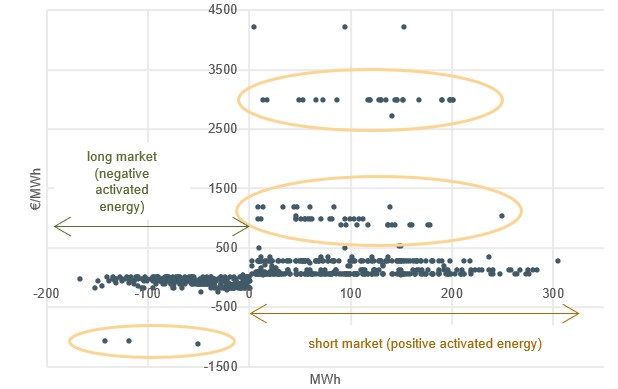
Source: ECA analysis – IPTO data
The price formations at the extremes are of particular interest and may warrant further investigation to explain what forced the IPTO to accept them.
Price spike drivers
In the absence of market manipulation, price spikes serve an important purpose in that they:
● Provide market participants with incentives to respond to system needs.
● Can reduce the need for capacity payments.
● Can permit generators to recover “missing money” by bidding at higher prices than their short run marginal cost during low margin periods.
● Stimulate investments in flexible response, innovation, and reliability.
Some drivers of price spikes are outlined below.
Variable Renewable Energy (VRE): VRE is now 34% of installed capacity in Greece. Short notice changes in forecasted VRE output linked to weather changes can cause costlier plants to be called upon in the BM to balance VRE output.
Unplanned outages close to real time.
Neighbouring countries: cross-border arbitrage affects local prices; during 30 Nov – 6 Dec, Greece experienced increased imports suggesting local deficits also contributed.
Peaking plants that deliver energy for short periods during peak demand or unforeseen events will have to factor in start-up and ramping costs.
Evidence of market manipulation?
With the adoption of a new electricity market, price volatility and high prices are not uncommon as was also observed, for example, in the cases of Great Britain (GB) in 2001 with the introduction of the New Electricity Trading Arrangements (NETA) and Ireland’s Integrated Single Electricity Market launch in October 2018.
Recent investigations of price spikes across Europe demonstrate that various factors are at play and regulatory responses have varied. Some examples include:
National Grid, GB’s Transmission System Operator (TSO) reported a 39% increase in BM costs between March and July 2020 and a 33% increase in November 2020. They were attributed to an increase of VRE in the energy mix, the effects of COVID-19 on demand and unforeseen weather. They resulted in a temporary cap of £15/MWh initially, reduced to £10/MWh thereafter.
Ireland experienced high balancing prices[2] on 24 January 2020 of up to €5,636.62/MWh. The investigation found that it was due to multiple and coinciding variables and events (wind, interconnector flows, security constraints); no fault in the calculation of imbalance prices or the rules was found.
InterGen was fined by the GB regulator, Ofgem, in April 2020 over energy market abuse in December 2016[3] for sending misleading signals to the TSO about the energy it could supply.
German regulator, Bundesnetzagentur, in September 2020 opened administrative fines proceedings against three electricity market participants on suspicion of market manipulation over three days in June 2019[4]. Balancing costs reached 37,856 €/MWh.
RAE’s regulatory response
On 31 December 2020 the results of RAE’s public consultation were published. The consultation apparently did not shed much light on what had driven the BM price spikes. Following its latest consultation between 7-14 January 2020, RAE announced that it will be introducing a floor of €0/MWh and that FFR must acknowledge plant technical restrictions. Specifically, the Minimum Stable Level must be respected in upward and downward balancing capacity offers. RAE has decided not to apply a cap at this stage in a move that suggests that it believes its actions so far are sufficient to avoid the previously observed high prices – BM prices have been lower since RAE’s announcement in December and prior to its regulatory intervention.
Way forward
Price spikes are not an unusual phenomenon especially in the infancy of a market. It is important to distinguish whether they are driven by market fundamentals or are the result of market manipulation. Price spikes could be highlighting other requirements, such as:
● Additional capacity investment
● Network investments
● Improved or enhanced reserves procurement.
Recent events in other markets show that price spike investigations need to be made on a case-by-case basis, and that they take time and are complex.
Price spikes can be due to one or a combination of factors, unrelated to market manipulation. Potential areas to investigate include:
● Implementation of market design, for example in the case of NETA which required many refinements during its introduction to address perceived shortcomings.
● Appropriate functioning of market rules including the dynamics and relative liquidity between DAM, IDM and BM including arbitrage between market timeframes; for example, during periods of tight margins, the risk of high imbalance cost increases can make the BM more attractive.
● A market participant can raise their price above marginal costs if there is insufficient competition, or if it has a large portfolio concentration or if there is information asymmetry (compared to other market participants).
● Impact of prices in connecting markets; arbitrage opportunities between the Greek and neighbouring markets.
● Physical events, for example, excessive outages.
● Understanding the volatility of the information from forecasting of parties during the DAM stage, particularly in relation to weather, VRE and demand.
● Vertical integration and market share. Market participants can act as generators, suppliers, or a combination. Their market share and structure can affect interests and bidding strategies.
Additionally, data over a short winter period during a COVID-19 outbreak do not necessarily provide a complete picture. Follow-up investigations will be required when market data over a longer period and seasons become available.
Regulatory intervention on market prices should not be implemented purely on the observation of high prices over a short timeframe, during the COVID-19 epidemic, but only in limited cases following an in-depth investigation and understanding of the root causes. The application of rigorous limits for the BM has the potential to cascade into the other (earlier) markets. Any enduring solution will have to be based on solid evidence and should balance the cost of intervention against the benefits of “correct” price signals, market response and effective competition.
[1]Dispatchable generating units having the obligation or the ability to operate both with primary and alternative fuels.
[2] View and download the Report on the Imbalance Prices calculated on 24.01.2019.pdf
[3] Visit www.ofgem.gov.uk to read – Ofgem requires intergen to pay 37m over energy market abuse
[4] https://www.bundesnetzagentur.de/SharedDocs/Press

John Paparistodemou
Senior Consultant
John is an experienced energy sector professional with expertise in electricity market analysis and modelling; economic regulation and pricing; system operations; investment planning; and strategic network planning. He has experience working with TSOs, DNOs, energy regulators, private investors and international finance institutions across the UK, Europe, Middle East, Southeast Asia and Southern Africa.
To contact John directly please email or connect with him on Linkedin below.