ECA INSIGHT >>
CMA and Ofwat follow ECA’s lead with a falling WACC for water companies
August 2015
The CMA’s report on Bristol Water’s appeal against Ofwat’s final determination of the 2014/15 periodic review allowed a WACC of 3.65%, which aligns with the downward trend from Ofwat’s own determinations (to 3.6% in December 2014). ECA’s own assessment in March 2014 led the way towards a lower WACC with a range of 3.0% to 3.75%, based on thorough analysis of the equity beta and acknowledgment of a persistent overly-cautious balance of the WACC against customers’ interests.
On 10 July, the Competition and Markets Authority (CMA) published its interim report on Bristol’s appeal against Ofwat’s final determination of the 2014/15 periodic review, allowing a WACC of 3.65%.
This is within ECA’s range of 3.0% to 3.75% (recommended in March 2014), and aligns with the downward trend from Ofwat’s guidance note of 3.85% (January 2014), draft determination of 3.70% (August 2014) and final determination of 3.60% (December 2014).
So what drove ECA to spearhead a falling WACC? And what was calculated differently to Ofwat in its recommended range?
Our approach
To arrive at its WACC estimates, ECA undertook both top-down and bottom-up assessments. In the top-down approach, ECA examined regulatory precedents on WACC in the water sector and other related sectors, particularly energy networks, and also considered market evidence of recent regulatory transactions.
ECA also undertook a more detailed bottom-up analysis assessing each of the WACC components and their drivers.
There was a particular focus on the calculation of the equity beta and the cost of debt, as these items are specific to the risk characteristics of the water sector rather than generic market parameters.
Top down – downward trend in WACC
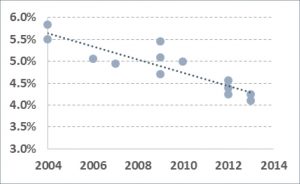
Figure 1: Trend of regulated Vanilla WACC values 2004-2013
Source: Ofwat, Ofgem & Competition Commission
Extrapolating Figure 1 suggests a continuing downward trend in WACC values. ECA contended that the cost of capital had been set at too high a level for some time, and that Regulators had been slowly reducing the allowed WACC to a level that better reflected the balance between company and customer interests.
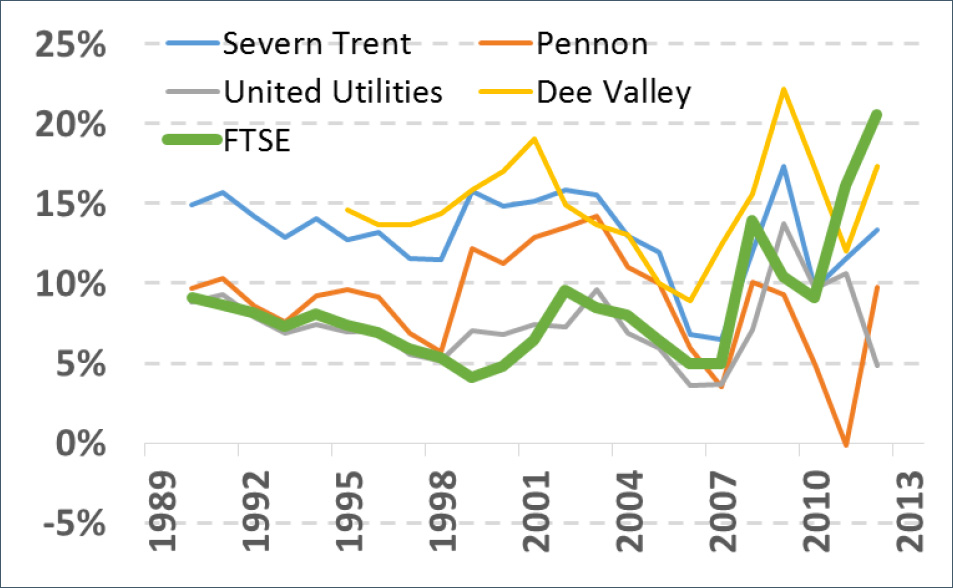
Figure 2: Annualised returns from progressive investments in water companies
Source: Yahoo finance data
ECA deduced this from evidence such as that presented in Figure 2, showing that investors who bought shares in the listed water companies at any time from 1989 until 2010 would have generally outperformed the market. This is surprising for regulated monopolies that should be less risky (and therefore offer lower returns) than the market as a whole.
Bottom up – Equity beta
Ofwat assumed an equity beta of 0.8 at the top end of an overall range of 0.75-0.80, citing company business plan estimates of
0.84 – 1.07. Through analysis from the share prices of the three largest listed companies (Severn Trent, Pennon and United Utilities), and consideration of market expectations of equity returns, ECA was able to recreate the shape of Ofwat’s equity beta graph. However, in a simple visual comparison, the absolute level of the equity beta in ECA’s analysis came out consistently lower than Ofwat’s.
ECA’s analysis identified that the period of returns and the dates on which returns are measured can produce markedly different estimates. For example, betas calculated from returns measured in the middle of a month are much more stable than returns from the beginning or end of a month. Similarly, outlier beta estimates in 4-week return periods from unusual trading could be mitigated by shifting all returns windows by two weeks.
While Ofwat measured a monthly beta from a single starting day, ECA’s analysis considered betas from a range of starting days within those periods (including all 31 possible starting days in a monthly return series), and return periods of various lengths. This produced a more reflective and smoother series of average equity betas.
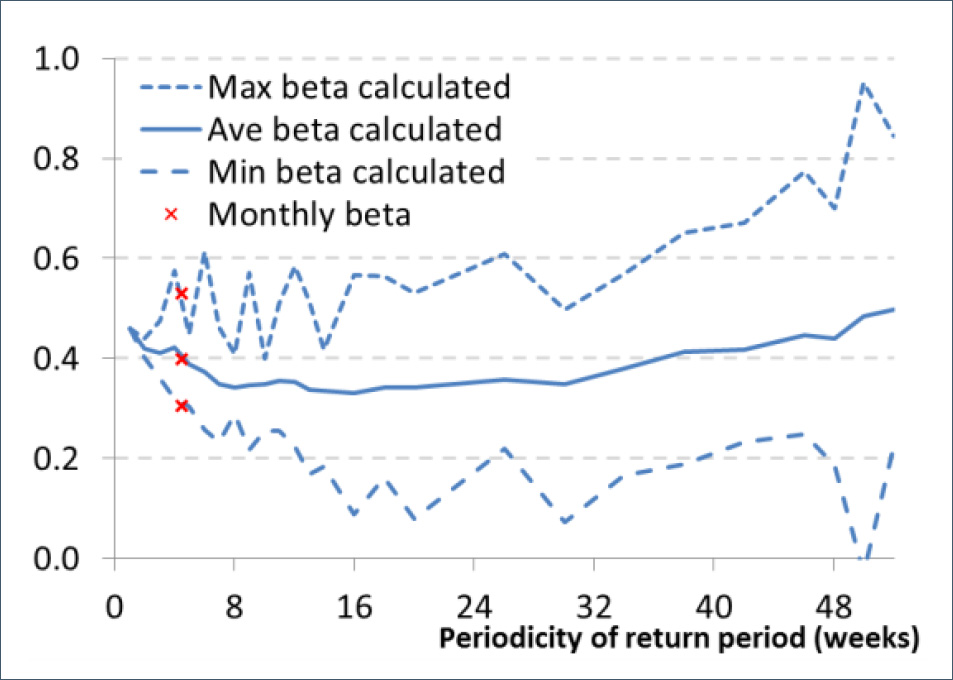
Figure 3: Average equity beta estimates over multiple return periods and series starting dates
Source: Yahoo finance data and ECA calculations
Figure 3 shows that this improved analytical approach derives an equity beta of 0.4, quite different from Ofwat’s estimate of 0.8. Nevertheless, considering market expectations on the equity beta and the observed regulatory practice of avoiding making too sharp adjustments in any one period, ECA’s proposed range was increased by 1 point to 0.5-0.6.
This lower beta signals that the systematic risk of publicly traded water companies is lower than previously perceived. Not surprisingly, Water companies experience stable cash flows from a fixed customer base, and therefore do not suffer from large fluctuations in operating revenue.
ECA’s analysis showed a downward trend in regulatory WACC decisions, possibly due to regulators correcting a previously over- cautious approach. Nevertheless, average equity betas calculated by Ofwat in the past and today remain higher than those derived from detailed and robust statistical analysis of the equity beta for the water industry.